How to Build a Construction Gantt Chart (September 2026)
Construction Gantt chart guide for September 2026. Learn setup steps, dependency types, and how to track baseline vs. actual progress to manage delays.
Construction projects run late at staggering rates, with the average job running 37% longer than planned. A Gantt chart won't fix that on its own, but a sloppy one makes it worse by hiding slippage until it's too late to do anything about it. The difference usually comes down to a few setup steps that most teams skip, and this covers all of them.
TLDR:
-
A construction Gantt chart maps every task, dependency, and milestone on one timeline so the full sequence is visible at once.
-
98% of construction projects face delays (Buildern, 2026); a baseline-versus-actual comparison lets you catch slippage while there's still float to recover.
-
Build your WBS fully before touching dates, map all dependency types, and update the schedule weekly at minimum during active construction.
-
Excel can produce a Gantt chart using a stacked bar workaround, but holds no dependency logic, so every date change requires manual downstream updates.
-
Constructable houses your MPP schedule as a full Gantt view next to your drawings, RFIs, and daily logs, without requiring a Microsoft Project license for the whole team.
What is a construction Gantt chart?
A construction Gantt chart is a horizontal bar chart that lays project tasks against a calendar. Each bar marks when a task starts, when it ends, and how long it runs. Stack those bars across the full job and you see the whole sequence at once, including which activities overlap and which ones depend on another finishing first.
The tool traces back to Henry Gantt, an American engineer who popularized it in the early 20th century. Construction turned out to be a natural fit. Jobs here run on ordered work, hard handoffs between trades, and dates that carry contractual weight, the same pressures that define what a general contractor does, so a visual timeline answers the question every schedule has to answer: what happens, in what order, and by when.
Key components of a construction Gantt chart
Every construction Gantt chart is built from a handful of parts. Get all of them on the page and the schedule holds up.
-
Task list or WBS: the vertical stack of activities, broken down from broad phases into workable pieces like site prep, footings, framing, and MEP rough-in.
-
Timeline axis: the horizontal calendar running across the top, scaled by day, week, or month.
-
Task bars: each bar's length shows duration, so a two-week framing run reads longer than a two-day inspection.
-
Dependency arrows: links that connect sequenced work, such as rough-in finishing before drywall can start.
-
Milestones: fixed markers for key deliverables like permit approval, dry-in, or final inspection.
-
Resource assignments: the crew, sub, or equipment tied to each bar.
How to build a construction Gantt chart step by step
Building a schedule follows the same order whether you work in Microsoft Project, Excel, or a dedicated scheduling tool. Work through these steps in sequence.
-
Start with a work breakdown structure. Split the project into phases, then break each phase into discrete tasks you can assign and track.
-
Define and group every task. List all activities under their phase so nothing slips between the WBS and the calendar.
-
Set durations. Estimate how long each task runs in days or weeks, grounded in crew size and production rates.
-
Map dependencies. Most construction work is finish-to-start, but flag start-to-start, finish-to-finish, and lag relationships where they apply.
-
Find the critical path. Identify the longest chain of dependent tasks, since any slip there pushes your completion date.
-
Insert milestones. Mark permits, dry-in, inspections, and handover as fixed checkpoints.
-
Assign resources. Tie each bar to the crew, sub, or equipment responsible.
-
Set a baseline. Lock the approved plan so you can compare planned dates against actual progress as the job runs.
How to make a construction Gantt chart in Excel
Excel has no native Gantt chart type, so you build one from a stacked bar chart. Set up your data first: one column each for Task Name, Start Date, End Date, and Duration.
-
Calculate duration with
=EndDate-StartDate+1so a same-day task still reads as one day. -
Select task names and start dates, then insert a 2-D stacked bar chart.
-
Add the duration column as a second series so each bar's length matches its run.
-
Select the start-date series, set its fill to no fill, and the task bars appear against the calendar.
-
Right-click the vertical axis, check Categories in reverse order, and the chart reads top to bottom.
To skip weekends, swap the formula for NETWORKDAYS(StartDate, EndDate).
The catch is maintenance. Excel holds no dependency logic, so when one task slips, you retype every downstream date by hand.
Free construction Gantt chart templates
Free Gantt chart templates come in two flavors. A blank simple template gives you empty rows and a calendar axis for any project. A construction-specific version arrives pre-loaded with phase groups like preconstruction, site work, framing, MEP rough-in, finishes, and closeout, so the structure already mirrors how commercial jobs sequence work. You fill in dates instead of rebuilding the skeleton every job.
| Format | Best for |
|---|---|
| Excel (including monthly views) | Formula-driven bars and offline editing |
| Google Sheets | Shared, real-time schedule access |
| Word | Static timelines for reports |
| PowerPoint | Presenting a schedule to owners |
| Canva | Visual timelines for proposals |
Vendors like Smartsheet, Vertex42, and TeamGantt offer free downloads. Pick the format your team already lives in, then swap the generic tasks for your real WBS.
How construction teams use Gantt charts
A single Gantt does different work depending on who's reading it.
-
Construction project managers sequence phases and track execution against the baseline, spotting slips before they compound.
-
Superintendents pull call times from it, so the framing sub shows up the day rough-in wraps and not a week early.
-
Owners and design teams read it for status, milestone dates, and where a decision is holding things up.
-
When a delay hits, the baseline-versus-actual gap becomes the record that supports a change order in construction or a claim.
Benefits of Gantt charts in construction
A Gantt chart won't stop a delay, but it gives you the visual structure to catch one early and respond before it cascades, a foundation the best construction management software builds on. 98% of construction projects face delays, with the average project running 37% longer than projected.
-
Visibility into sequence: seeing phase overlap on one timeline tells you when a slip in framing squeezes MEP rough-in, so you plan around it instead of finding out on site.
-
Early slippage detection: the baseline-versus-actual gap surfaces a lagging task while there's still float to recover, not after the completion date has moved.
-
Accountability: named resources on each bar mean firms hit by supply chain and labor delays can trace which task and party absorbed the hit.
-
Transparent communication: owners and lenders read milestone dates straight off the chart, keeping status conversations grounded in the same picture everyone works from.
Limitations of construction Gantt charts
A Gantt chart is only as good as its upkeep, and that is where most of the drawbacks start.
-
Scale gets unwieldy. A commercial job with hundreds of activities turns a Gantt into a wall of bars no one can read at a glance.
-
Static tools demand constant manual maintenance. Every date change ripples downstream, and in a spreadsheet you update those rows by hand.
-
The bars imply precision the durations don't have. An estimate displayed as a crisp two-week block can read like a promise.
-
It shows time, not resource loading or cost. Crew leveling and cash flow live outside the chart.
The deeper risk is staleness. A Gantt that stops getting updated becomes a historical artifact, a record of what you planned instead of a guide to what happens next.
Gantt charts vs. other construction scheduling methods
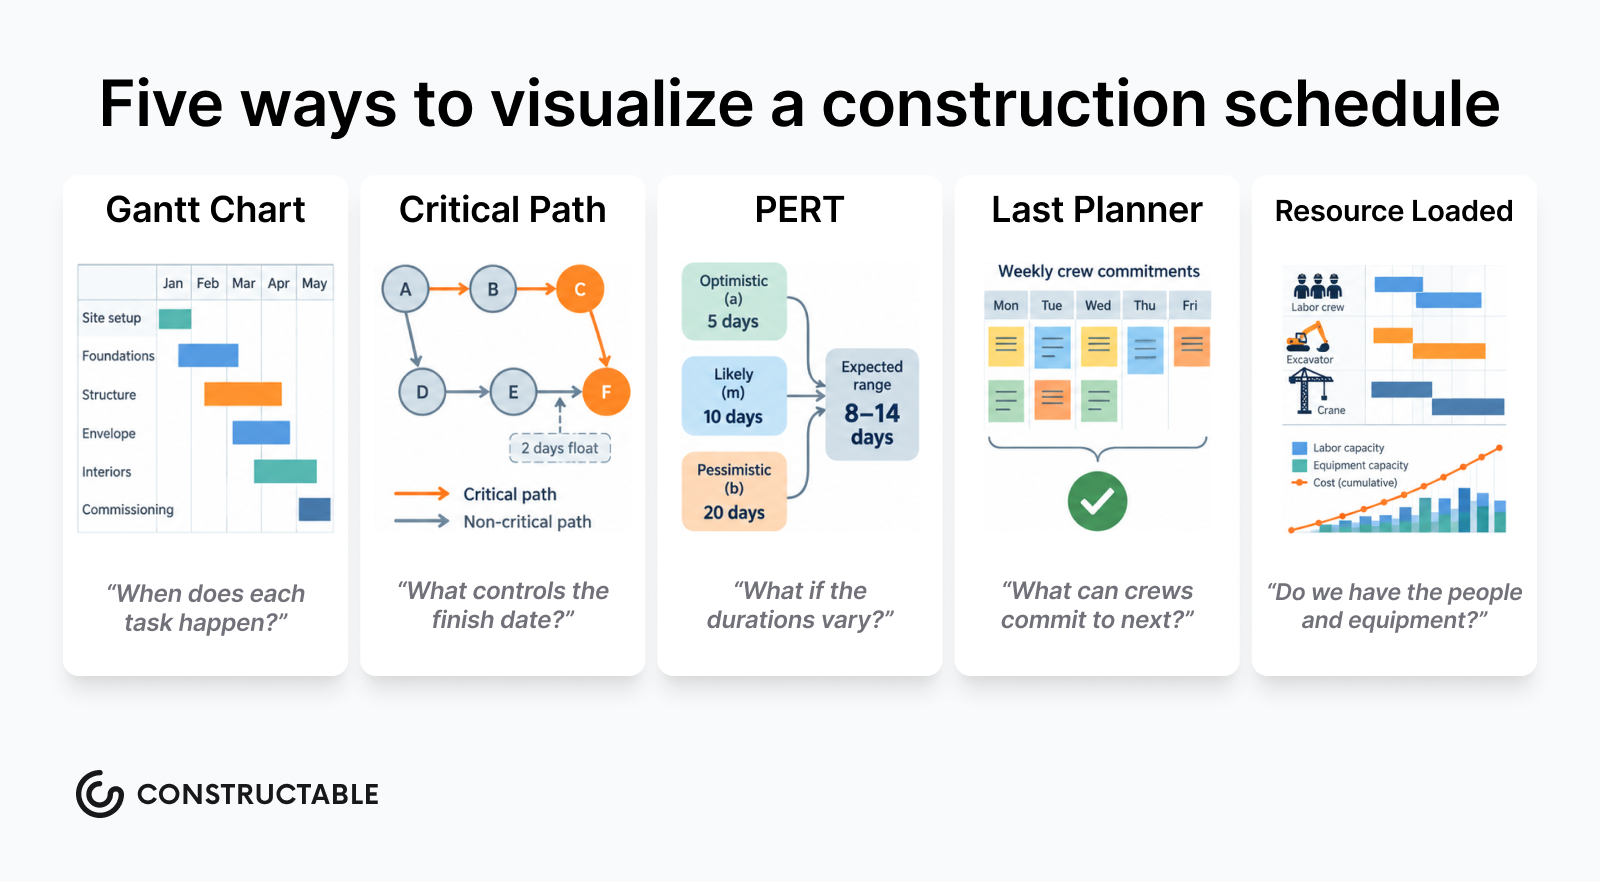
A Gantt chart is one scheduling method among several, and each answers a different question.
-
CPM (Critical Path Method): builds a logical network of dependencies to calculate the critical path and float. CPM and Gantt usually work together, with CPM doing the math and the Gantt chart serving as the visual output that communicates it.
-
PERT (Program Evaluation and Review Technique): weights optimistic, likely, and pessimistic durations to model uncertainty on jobs where estimates are shaky.
-
Last Planner System: a lean, pull-based method that plans short-interval work through crew commitments instead of a top-down bar chart.
-
Resource-loaded schedules: layer crew, equipment, and cost onto the timeline for leveling and cash flow.
Reach for a Gantt when phases run in clear sequence, when you need one picture diverse stakeholders can read, or on shorter jobs. Let an analytical method lead when the network is dense, durations are uncertain, or resource conflicts drive the schedule.
Construction Gantt chart best practices
A schedule earns trust when it stays readable and current. These habits keep a Gantt guiding the job instead of getting filed after week one.
-
Build the WBS fully before you touch the timeline. The task list is the foundation; dates come after.
-
Keep granularity consistent. Don't mix two-hour tasks with two-month phases on the same chart.
-
Map every dependency type, including finish-to-start, start-to-start, and lag relationships, since all of them shape your sequence.
-
Build float in explicitly. Hidden buffer disappears the moment someone questions a date.
-
Update on a fixed cadence, weekly at minimum during active construction.
-
Use color coding and phase grouping so anyone reads the chart at a glance.
-
Share a view-only version with subs so field teams pull from one source of truth, a practice at the core of drawing-centric collaboration workflows.
How Constructable fits into your construction schedule
A quick clarification before you swap tools: Constructable is not a Gantt authoring tool (yet), and it does not replace Microsoft Project or your other scheduling software. What it does is give the schedule a home inside the same system as your drawings, RFIs, submittals, daily logs, and financial data, as part of a broader set of project management tools built into Constructable.
The master schedule still lives in Microsoft Project or Primavera. Constructable is where that file is issued, read, and planned against, in the same project as your drawings, RFIs, submittals, daily logs, and financials.
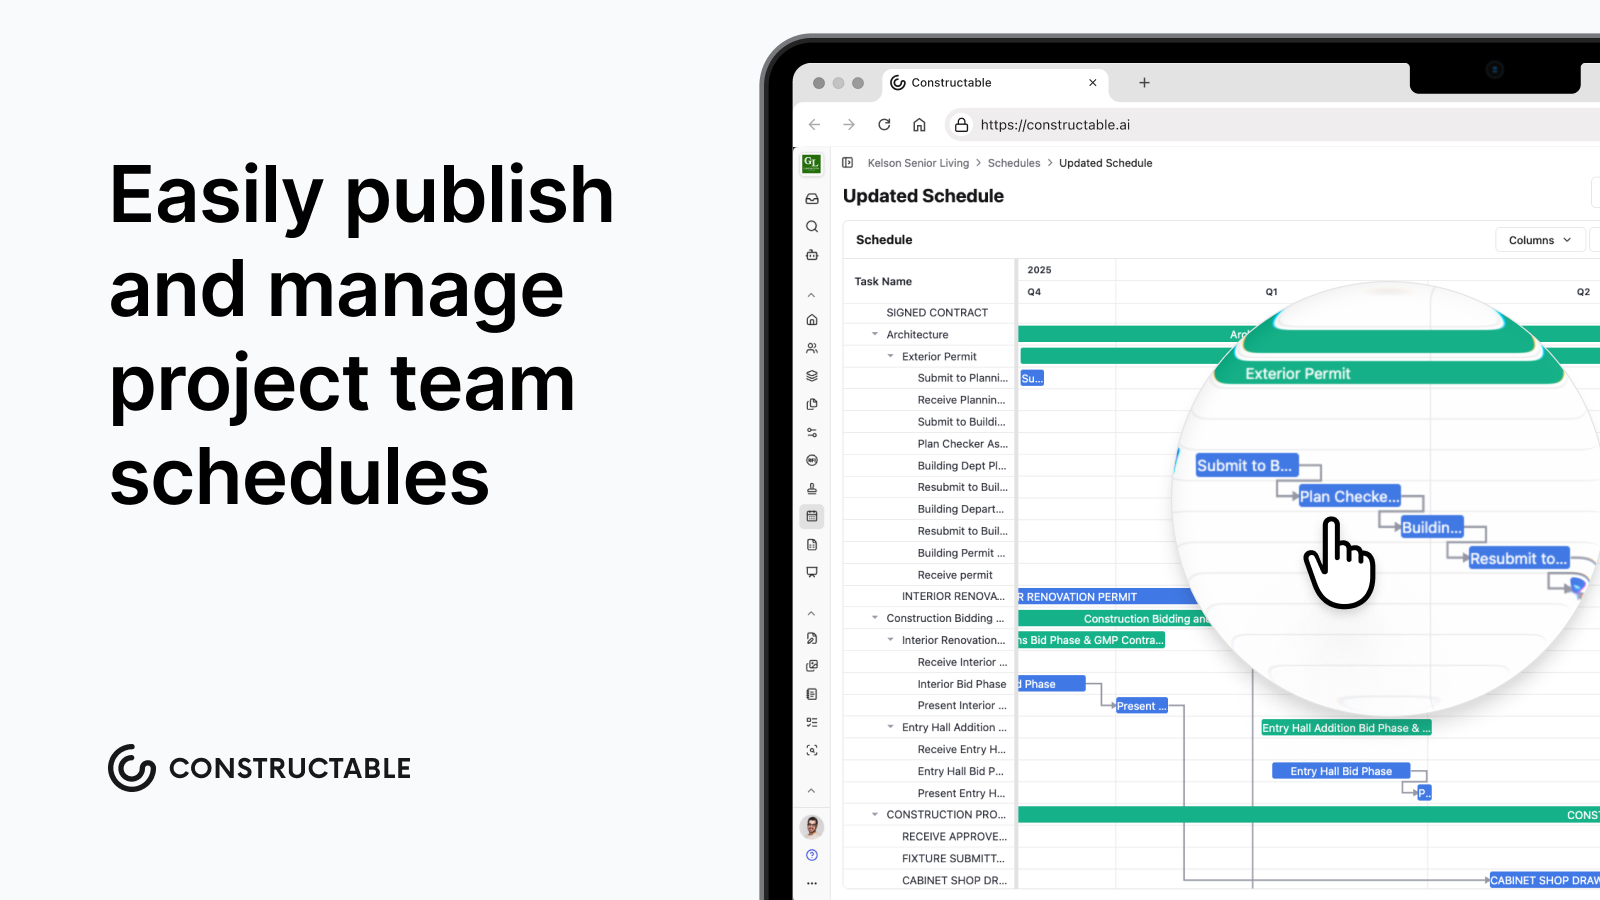
Upload a Microsoft Project (.mpp) or Primavera (.xer) file in Schedules. When the import finishes, it opens as a Gantt chart: sticky column headers, horizontal scrolling on the activity columns and the timeline, and dependency arrows between activities. The imported activities are read-only. Change dates and logic in your scheduling application, then replace the file.
A new schedule starts Unpublished, so schedule managers can review it before it goes out. Publish Schedule makes it visible to anyone who can view published schedules. They read the Gantt in Constructable, no separate Microsoft Project license required.
Lookahead is the part you write in Constructable. On the same imported plan, open Lookahead and add the next one to eight weeks of work: tasks under an activity or on their own, with a company, an assignee, a crew size, and dates. Drag a bar to move a task. Export that window as a PDF for the field. Dependency arrows stay on the Schedule view.
Schedules is its own item in the project menu, alongside drawings, RFIs, and daily logs, so the issued plan and the field record are in one system.
Check out this quick overview video of the Schedule Lookahead feature in Constructable:
Final thoughts on Gantt charts for construction projects
A Gantt chart is only as good as the last time someone updated it. Build it carefully, map your dependencies, and share it with your team so everyone pulls from the same source. When a delay hits, a current schedule with a locked baseline is what turns a problem into a documented event instead of an argument. See how Constructable connects your schedule.
FAQs
What's the difference between a Gantt chart and CPM scheduling for a construction project?
A Gantt chart and CPM work together as complements: CPM calculates the critical path and float through a dependency network, while the Gantt chart is the visual output that communicates that sequence to your team, subs, and owner. For most commercial jobs, CPM does the analytical work and the Gantt chart is what you put in front of people.
Can I build a usable construction Gantt chart in Excel without buying scheduling software?
Yes. Excel's stacked bar chart can be converted into a functional Gantt chart using start date, end date, and a duration formula (=EndDate-StartDate+1). The tradeoff is maintenance: Excel holds no dependency logic, so when one task slips, every downstream date has to be updated by hand. That's workable on a short job but becomes a real burden on a multi-phase commercial project.
How do construction teams use a Gantt chart to support a delay claim or change order?
The baseline is the key. Once you lock the approved schedule, any gap between planned dates and actual progress becomes a documented record: who was responsible, which task absorbed the slip, and when it happened. That baseline-versus-actual comparison is what turns a Gantt chart from a planning tool into evidence that supports a claim or a schedule-impact change order.
Does Constructable replace Microsoft Project for Gantt chart authoring and schedule management?
No. Constructable is not a full-on schedule-building tool and it isn't designed to fully replace Microsoft Project or other scheduling software for authoring or editing Gantt charts. What it does is give your schedule a home inside the same system as your drawings, RFIs, submittals, and daily logs: upload an MPP file and it opens as a Gantt chart with sticky column headers, horizontal scrolling, and visual dependency arrows, visible to the full team without requiring a Project license.
What free Gantt chart template format works best for a construction project?
Excel is the most practical starting point for most commercial construction teams because it supports formula-driven duration bars and works offline. If your team shares schedules in real time across the office and field, a Google Sheets gantt chart template removes the version-control problem. Word, PowerPoint, and Canva templates are better suited for presenting a timeline to an owner or including it in a proposal, not for actively managing a live schedule.